10 Things I Have Learned from 10,000 Views on YouTube
Today marks the 6-month anniversary of the video series I made on "50 Ideas to Improve Staffing and Recruitment in the Public Service". I have been tracking statistics since day one, and coincidentally, today is also the day the series made it past 10,000 views on YouTube!
What else can we learn from the data? Here are 10 things:
1. More than a quarter of all the views happened in the first 2 days after release (!); half of all the views happened in the first 2 weeks; three-quarters in the first 6 weeks.
2. Approximately 25% of the people I emailed about the video series (in majority public service HR professionals working in staffing and/or recruitment) clicked through and watched at least the introduction video in the first month of release.
3. 35% of the viewers didn't go past the first video (see graph below).
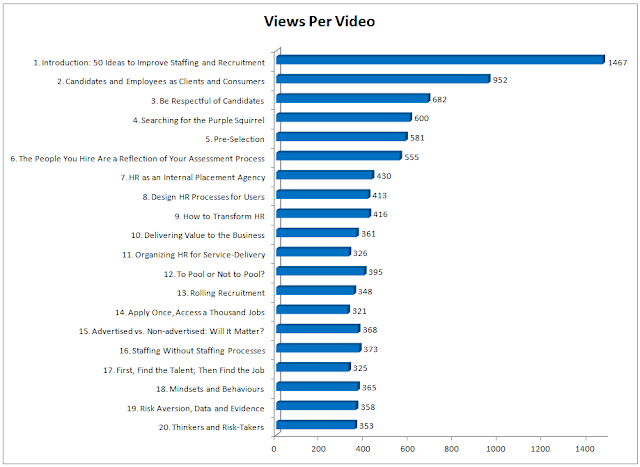
4. The next sharpest drops in views happened after watching the following videos:
(I can't help but wonder if there's a commonality among those three videos that might explain the sharper drops. If you have have a theory, please offer it below!)
5. While in general views declined with every succeeding video, three clips broke the trend and received more views than the vignette that preceded them:
(Here I have a bit of a theory on why these three videos broke the trend of declining views, but I am more curious to hear what yours might be, so please comment below...)
6. The least watched video received 321 views, which suggests to me that this also reflects the number of viewers who watched the entire 20-video series (not accounting for group viewings, which I'm aware took place in some departments and agencies).
7. Overall, the increase in viewership slows down with time (as seen in the graph below), with one notable exception coinciding with the NCR Innovation Fair on May 22, 2019.

8. The YouTube Studio analytics reveal that the following devices were used to watch the videos (percentage of watch time):
9. The YouTube Studio analytics further indicate the composition of the viewership (based on logged-in users):
10. While I deactivated the comments feature on YouTube, several people have taken the time to email me and share their impressions. Here are some of the highlights:
What other interpretation do you make of these findings? Please comment below.
What else can we learn from the data? Here are 10 things:
1. More than a quarter of all the views happened in the first 2 days after release (!); half of all the views happened in the first 2 weeks; three-quarters in the first 6 weeks.
2. Approximately 25% of the people I emailed about the video series (in majority public service HR professionals working in staffing and/or recruitment) clicked through and watched at least the introduction video in the first month of release.
3. 35% of the viewers didn't go past the first video (see graph below).

4. The next sharpest drops in views happened after watching the following videos:
- Candidates and Employees as Clients and Consumers
- Be Respectful of Candidates
- The People You Hire Are a Reflection of Your Assessment
(I can't help but wonder if there's a commonality among those three videos that might explain the sharper drops. If you have have a theory, please offer it below!)
5. While in general views declined with every succeeding video, three clips broke the trend and received more views than the vignette that preceded them:
- To Pool or Not to Pool? (21% or 59 more views than predecessor)
- Advertised vs. Non-advertised: Will It Matter? (15% or 47 more views than predecessor)
- Mindsets and Behaviours (12% or 40 more views than predecessor)
(Here I have a bit of a theory on why these three videos broke the trend of declining views, but I am more curious to hear what yours might be, so please comment below...)
6. The least watched video received 321 views, which suggests to me that this also reflects the number of viewers who watched the entire 20-video series (not accounting for group viewings, which I'm aware took place in some departments and agencies).
7. Overall, the increase in viewership slows down with time (as seen in the graph below), with one notable exception coinciding with the NCR Innovation Fair on May 22, 2019.

8. The YouTube Studio analytics reveal that the following devices were used to watch the videos (percentage of watch time):
- Computer: 80.5%
- Mobile phones: 16%
- Tablets: 3%
- TV: 0.6%
9. The YouTube Studio analytics further indicate the composition of the viewership (based on logged-in users):
- 55.7% male / 44.3% female
- 79.8% aged 35-44 years old / 20.2% aged 25-34 years old
10. While I deactivated the comments feature on YouTube, several people have taken the time to email me and share their impressions. Here are some of the highlights:
- Most frequent comment: appreciation for the tight format (i.e. densely packed 2-minute videos).
- Most frequent comment from Senior HR Executives: "This was long overdue!" (Seriously, I received this comment from more than one person!).
- An early adopter and binge-watcher who made my day: Shortly after 8pm, and less than 12 hours after publication of the videos on YouTube, I received an email from someone letting me know they were already half-way through the series. The viewer in question: Patrick Borbey, the President of the Public Service Commission!
- And perhaps my favourite comment:
"Please pass my Kudos to your management that supported the initiative and supported you in taking the risk."
What other interpretation do you make of these findings? Please comment below.
